Appearance
Statistics
The statistical function within the Cloud EMS enables users to analyze historical energy production data from equipment and energy consumption data from the load in a more intuitive manner. Trends can be easily observed using column charts and line graphs, providing a clear visual representation of past performance.
Energy
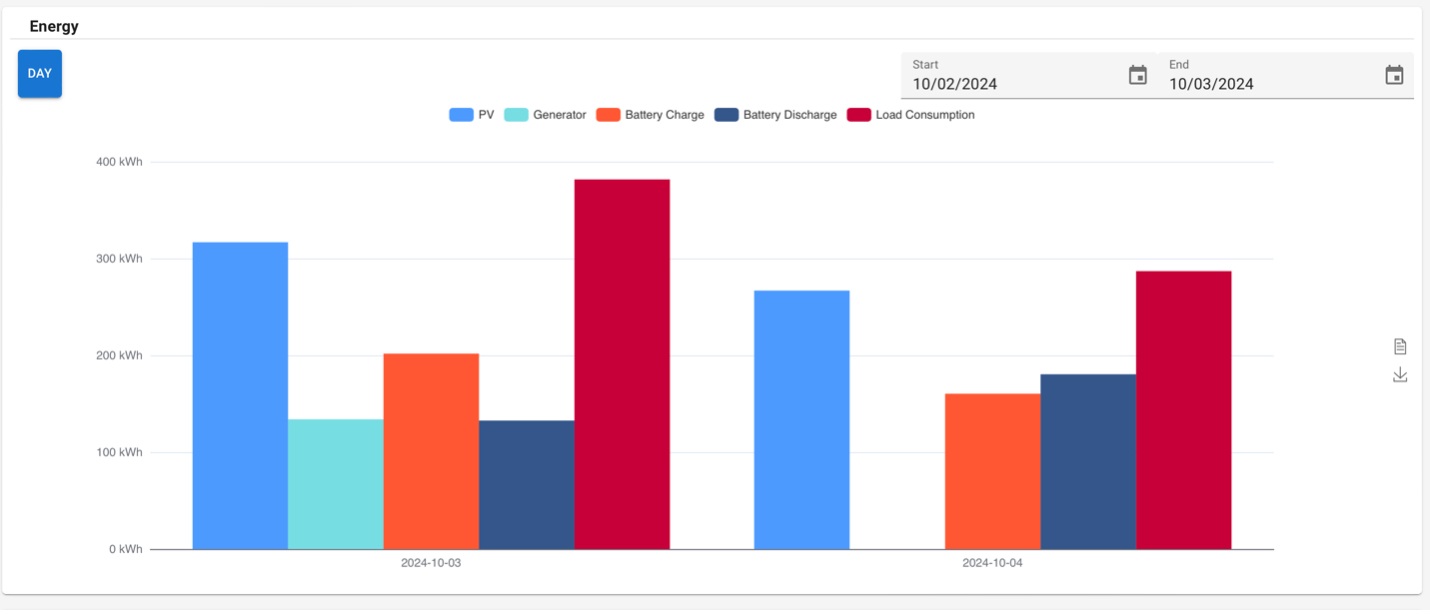
In the Energy section, each device's daily energy production is displayed in its respective column. Users can view historical energy production by selecting the start and end dates using the date selection tool located in the top right corner of the screen.
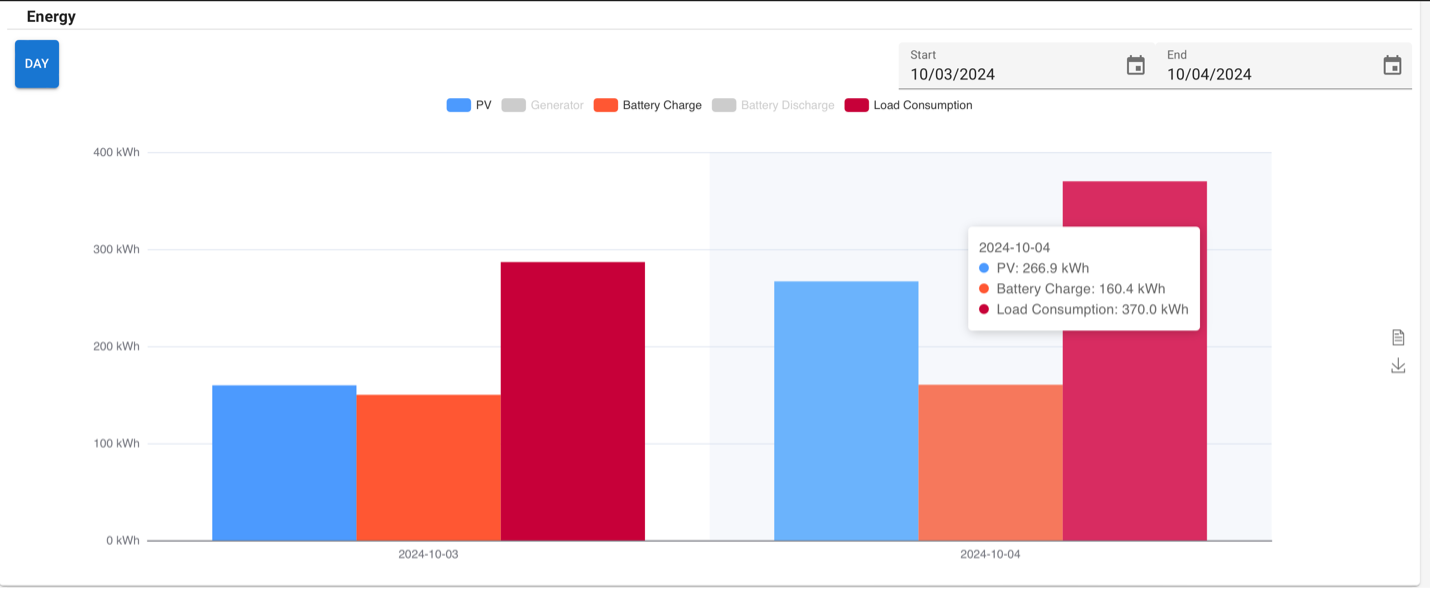
Users can toggle specific data types on or off according to their preferences. By selecting or deselecting the corresponding data labels (e.g., PV, Generator, Battery Charge, Battery Discharge, and Load Consumption), users can customize the data displayed in the chart. This feature allows for focused analysis on energy metrics, enhancing the flexibility of data visualization.
Power
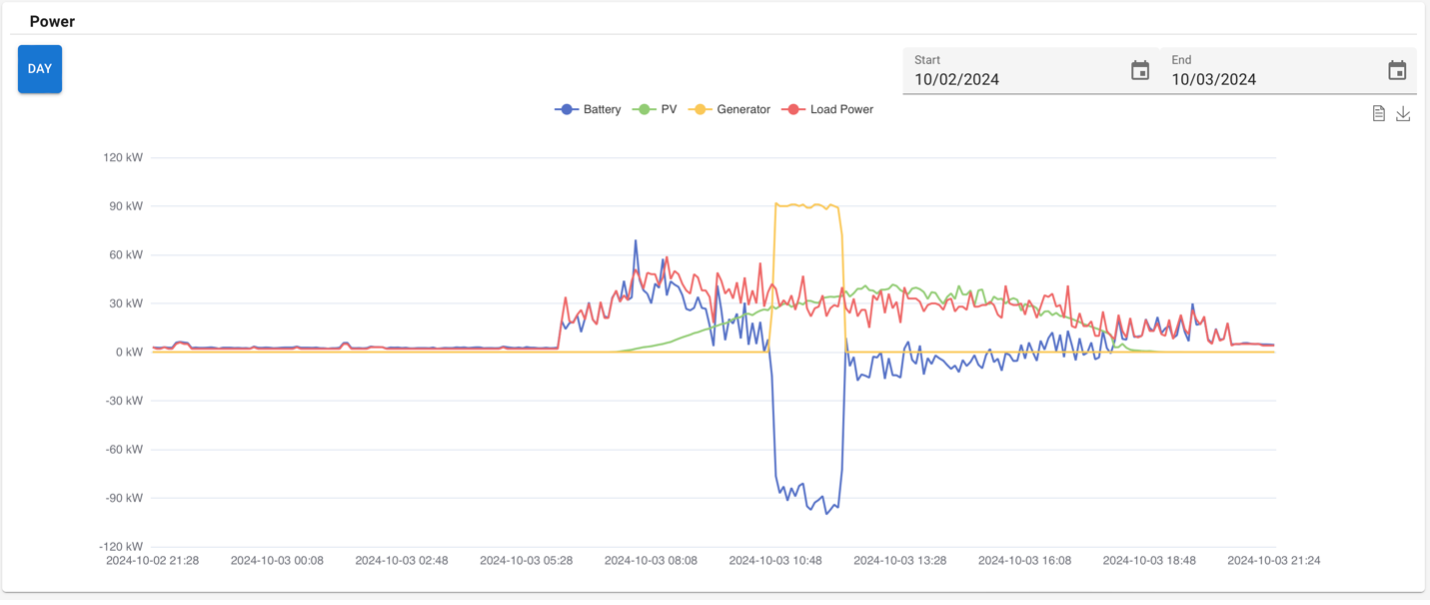
In the Power section, power output changes over time are displayed. Users can observe peak power outputs for the generator, PV, and battery, as well as the time slots during which each device operates.
For a broader analysis, users can select the start and end dates to access a wider range of historical power data, enabling deeper insights into system performance.
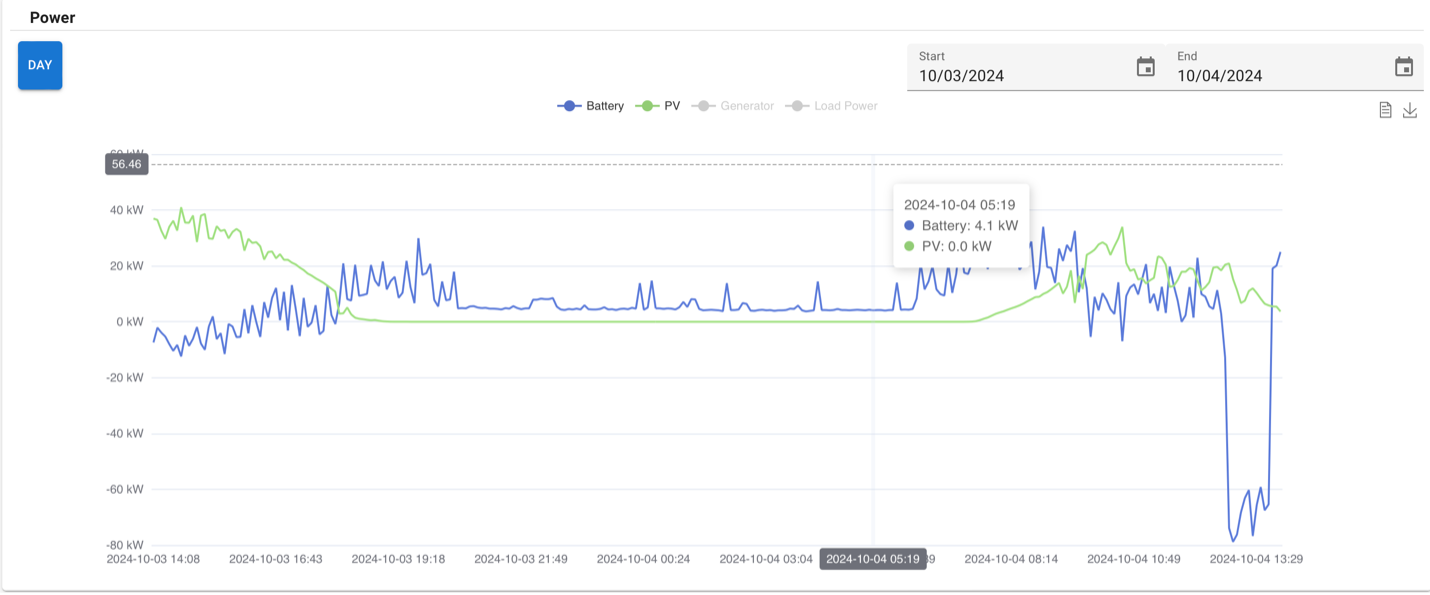
Users can selectively toggle different power data types based on their requirements. By enabling or disabling specific power metrics (e.g., PV Power, Generator Power, Battery Charge Power, Battery Discharge Power, and Load Power), users can tailor the displayed information to focus on relevant power statistics. This allows for a more targeted analysis of power performance and system efficiency.